
On this page you will find links to Addvance’s Desmos activities. These are designed to complement GCSE, A-level or IB curriculum with modern technology to visualise the concepts we’re studying at school.
Our resources are designed to allow you and students to interact with the graphs to see how manipulating one variable can affect another.
We recommend using these for rich classroom discussion, talking to students about what notice and promoting deep conceptual understanding.
Comment below with how you’ve used them, and the kind of questions you’ve asked to promote rich classroom discussion 😊
Visualising Maths is the first step to understanding Maths.
Addvance Maths

How do we make Desmos applets?
You can learn how to make your own Desmos resources from our Desmos workshop. Watch now!
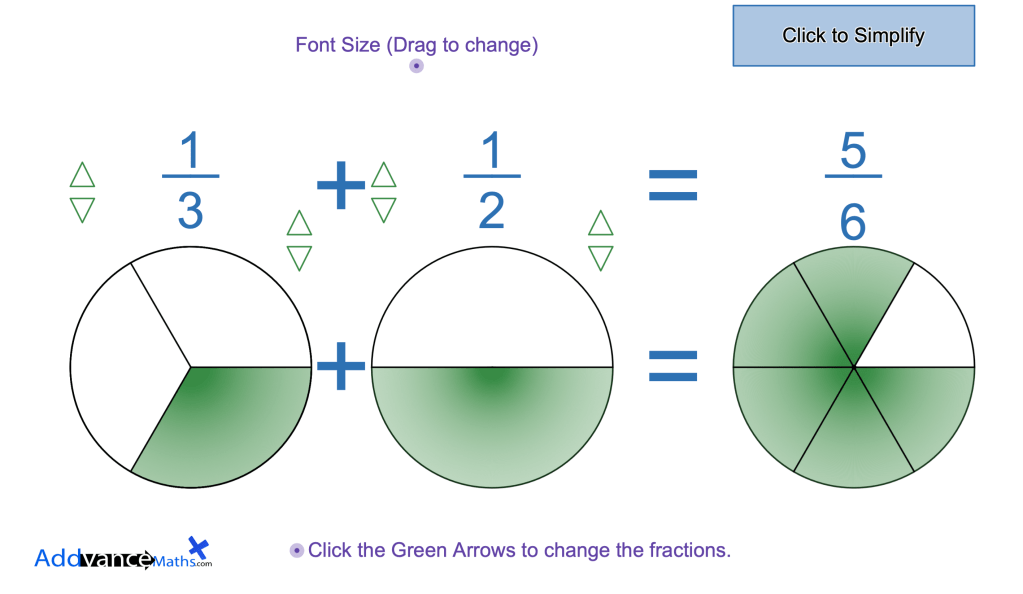
Adding Fractions
This neat little Desmos Applet lets you see the concrete and representational view of fractions together.
You can adjust the fractions by clicking the green arrows, and you can simplify the answer in a click. Also works when the answer is a mixed number.
More about fractions here: Fractions revision page!
This is the perfect visualisation to help students understand the trapezium rule.
It is also helpful to convince students that integration accurately evaluates the area under the curve.
Change a, b and n to see how the trapezium rule adapts. You can also change the starting function. Enjoy!
GCSE Circle Theorems – Interactive
All of GCSE Circle Theorems covered with these interactive demonstrations all on one page.

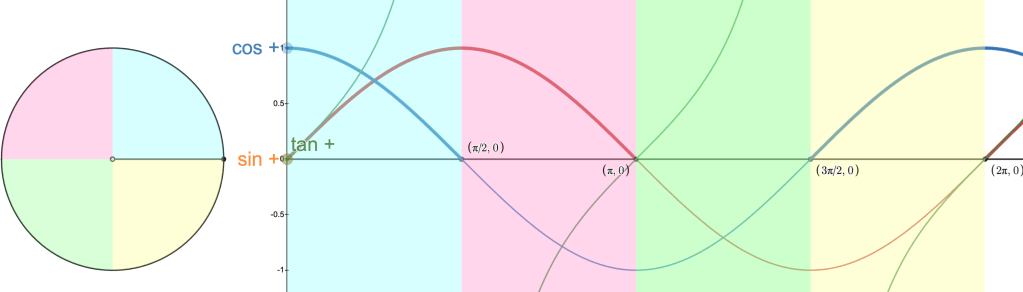
An interactive demo of CAST diagrams!
Desmos resource: CAST Diagrams

Voronoi Diagrams – Interactive
Drag the coordinates around on screen and see how the Voronoi changes.
What do you notice?
Perfect for introducing Voronoi diagrams for the first time!
Here you can use the sliders above each number to adjust the parameters of an equation. The value of the equation automatically updates in real time.
Great for teaching conceptual understanding of for variables are proportional/inversely proportional to each other.
Also include an equation evolving subtraction.

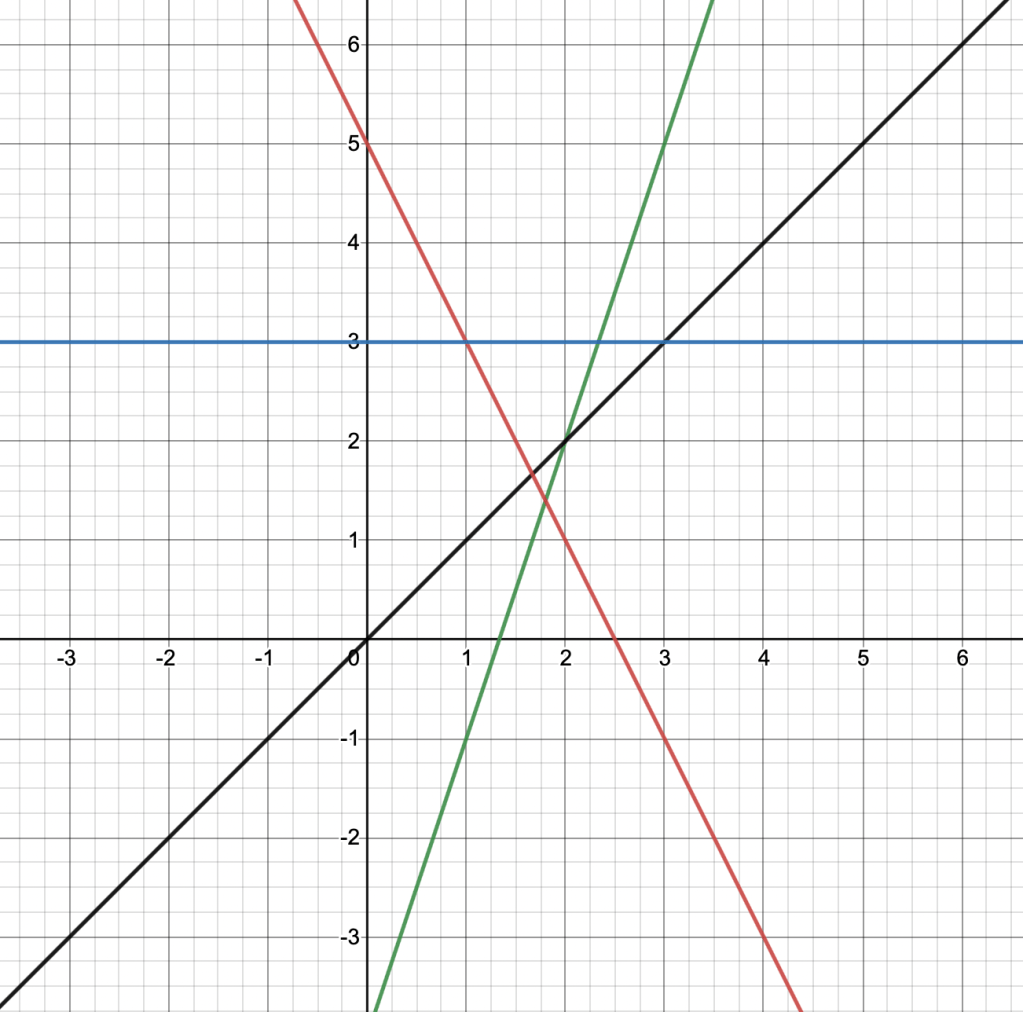
Straight Line Graphs Visualisation
This helps students visualise and conceptualise straight line graphs.
Click on the rectangular buttons to focus on different parts of the graph.
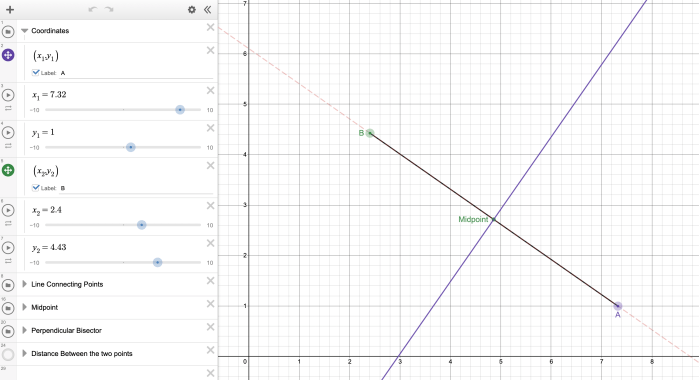
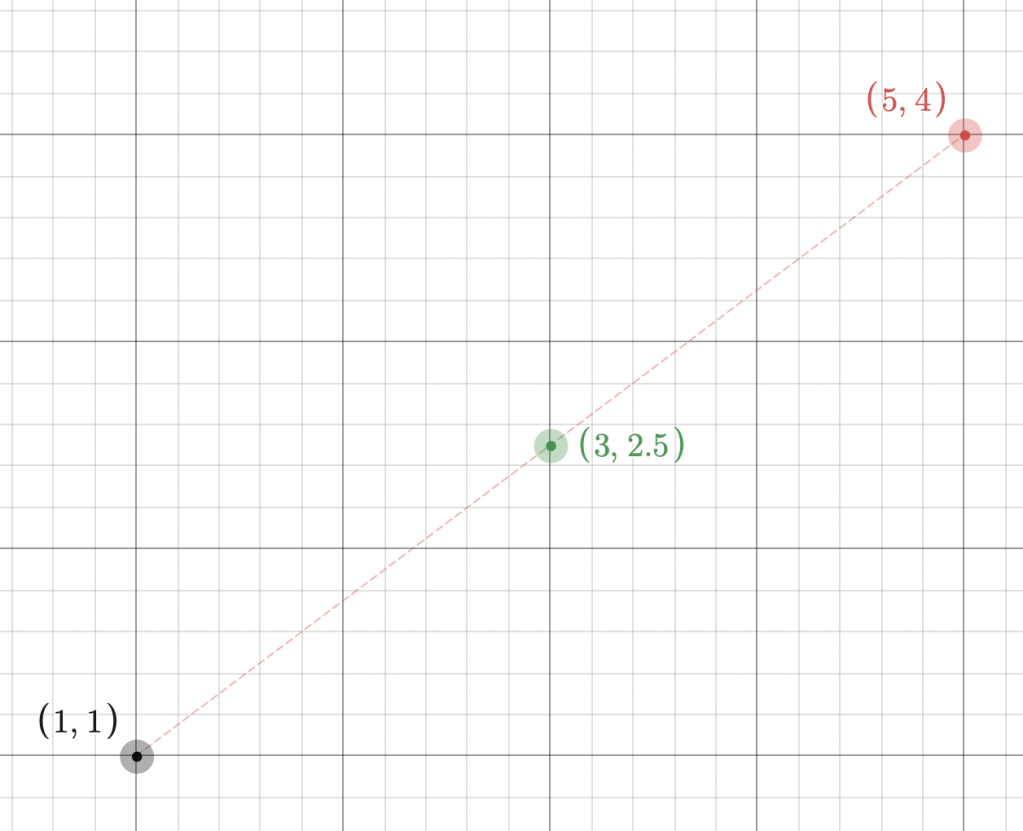
Straight Line Graphs Investigation.
Drag the points A and B around. The website will draw the Straight Line between the 2 points, the midpoint and the perpendicular bisector.
Can you predict the equation of these straight lines from the coordinates?
This video may help.
The website will also tell you the gradient (m) and the y-intercept (c) of the 2 lines.
Use this resource to interact with and explore Straight Line Graphs.
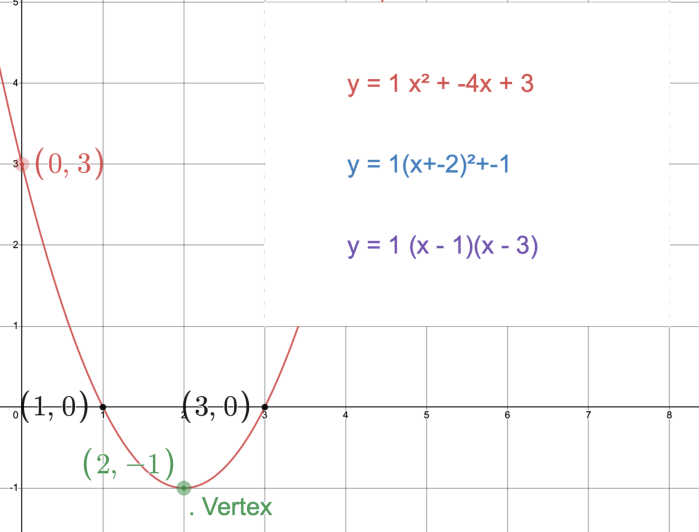
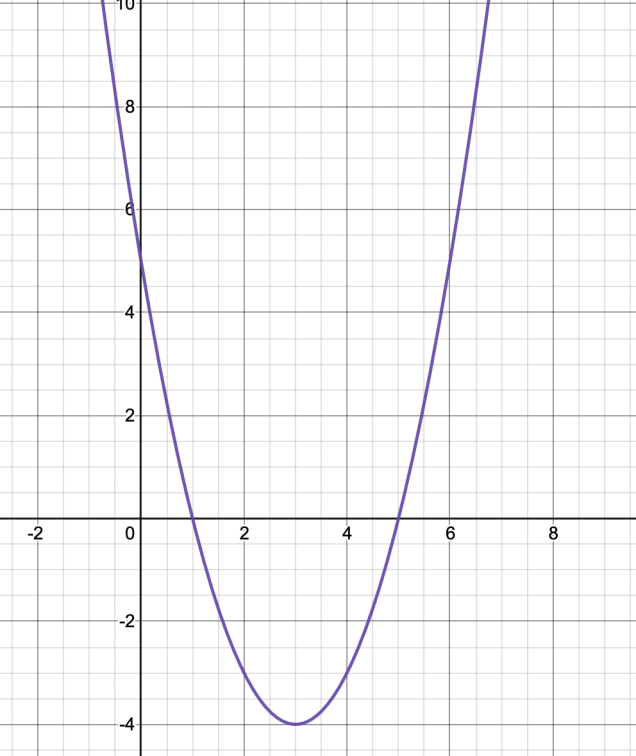
Quadratic: Three Forms of the Equation
This nifty little graph displays the three versions of the same equation: standard quadratic, factorised and complete the square form.
This helps students see the connection between the graph and the equations.
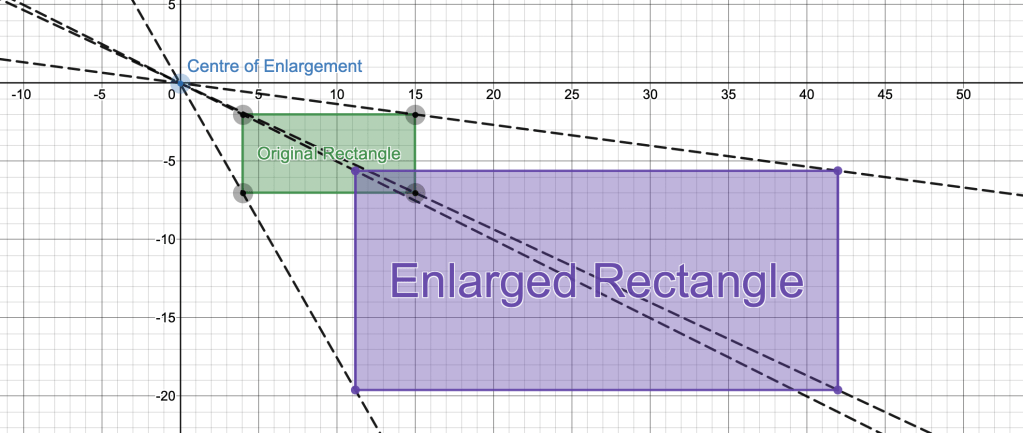
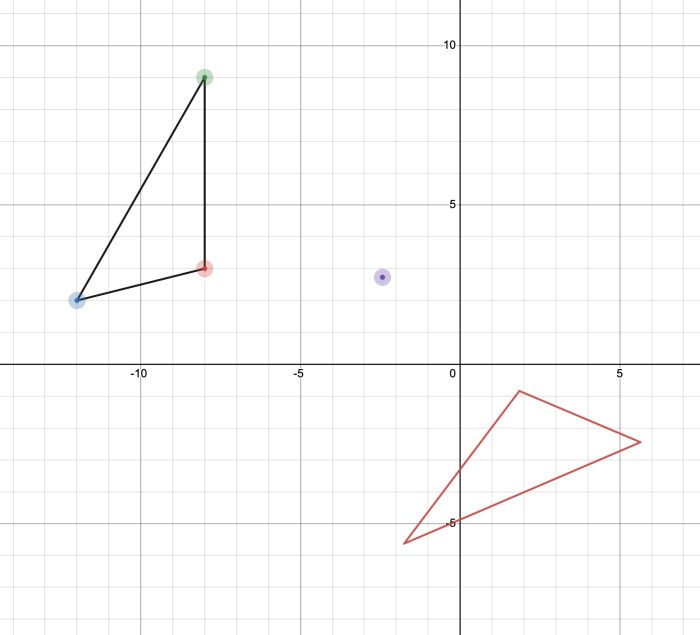
Transformations: Enlargements of Shapes
See how the centre of enlargement and the scale factor changes the transformed shape. You can also drag the corners around and see how things change.
Updated: Enlargements with Triangles
This version is effective for seeing how the shape flips with a negative scale factor.
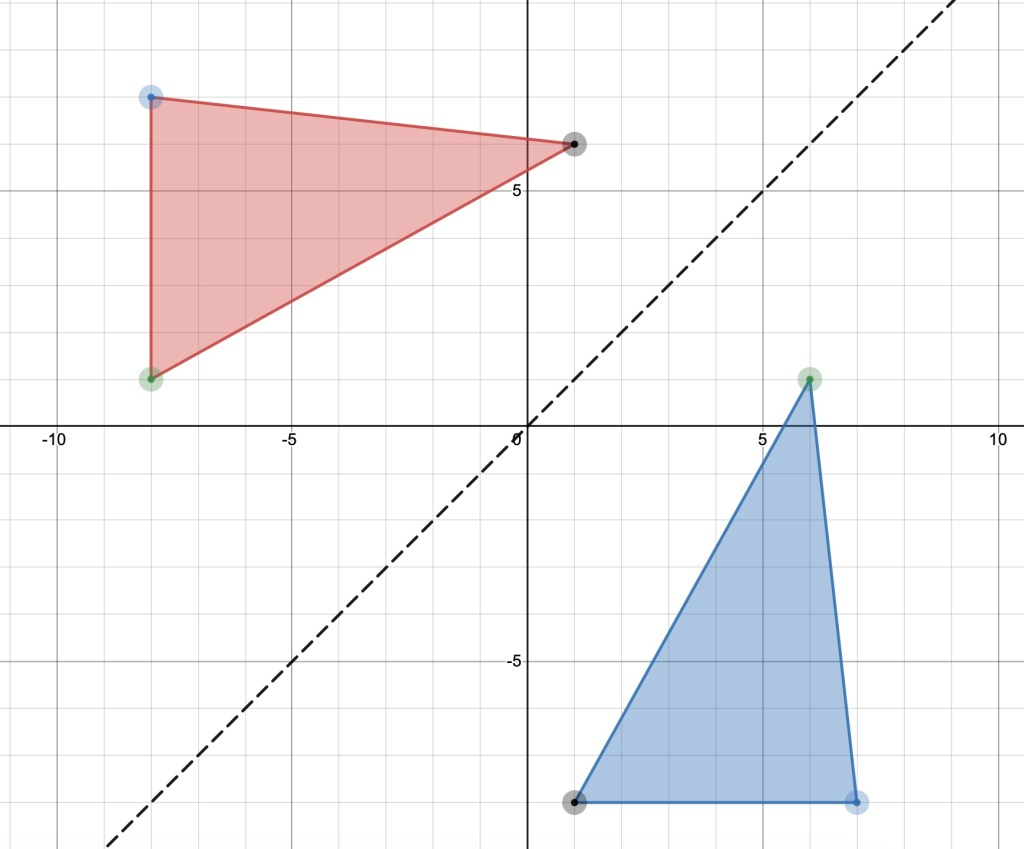
Transformations: Reflections
See how two reflected triangles interact as you adjust the coordinates of the points yourself!
See how the vector and the corners of a shape lead to a translation.
Fully interactive!
See how the original shape, centre of rotation and the angle of rotation affects a transformation.
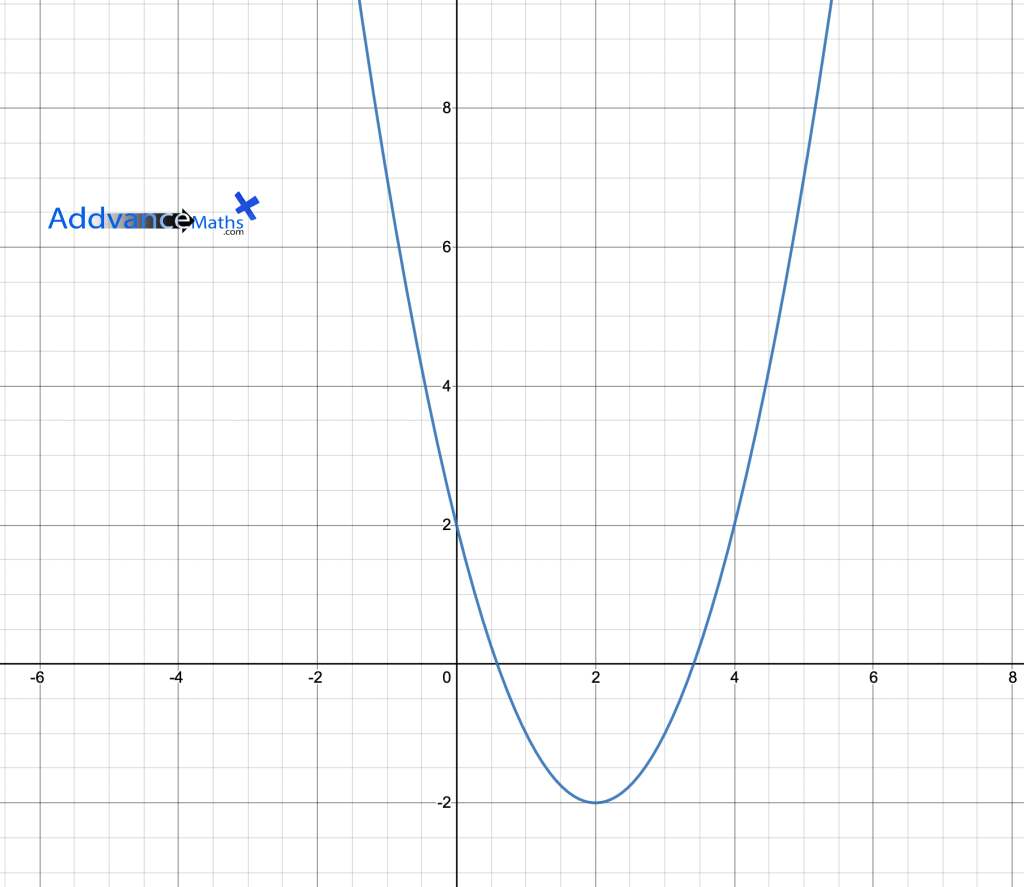
Follow the steps to see how to plot a quadratic graph.
This video will help.
Integration: Area Between Two Curves

See visually how to calculate the area between two curves.
Now updated to show the value of the areas under each curve.
This video will help.
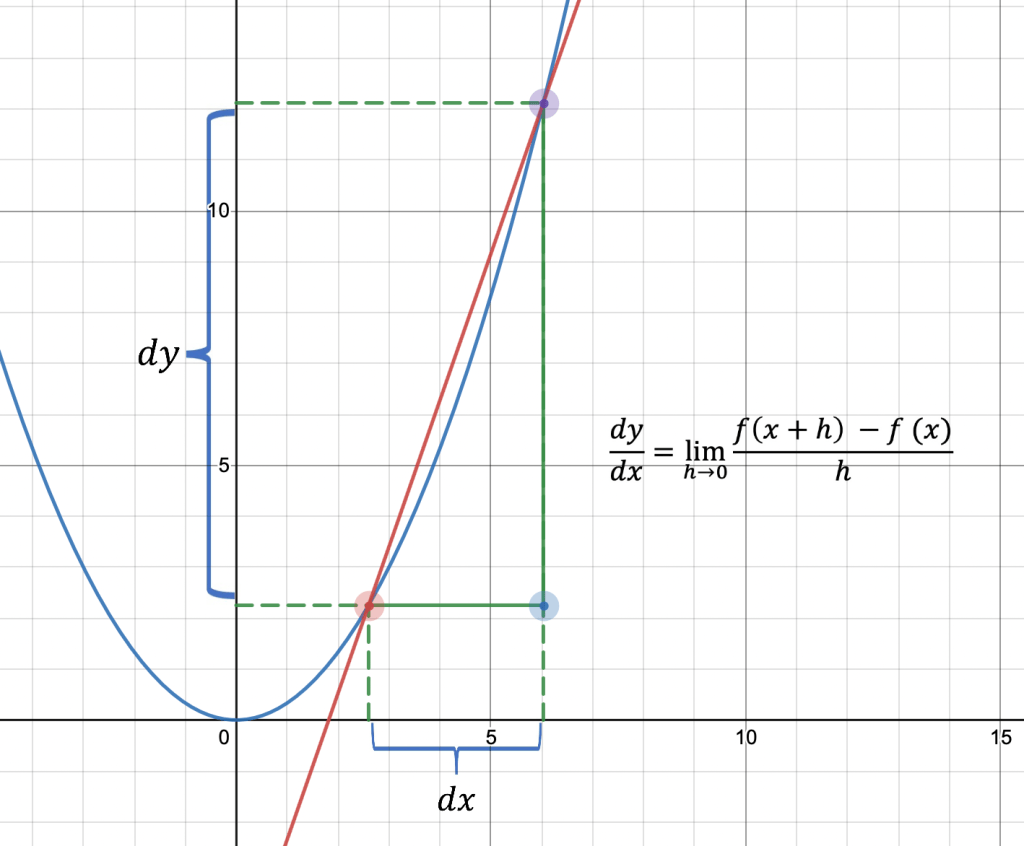
Differentiation from First Principles
See visually how to approximate a tangent line and see how this leads to differentiation from first principles.
This video will help.
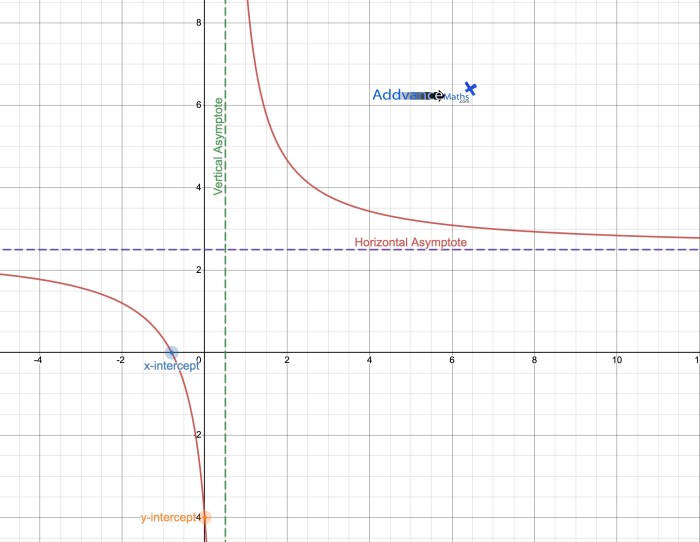
This cool interactive demo will show you how a,b,c and d affect the asymptotes and intercepts of a rational function graph.
It also includes the inverse function.
Use this to check your rational function sketches are accurate or to help visualise rational function curves.
Great for IBDP.
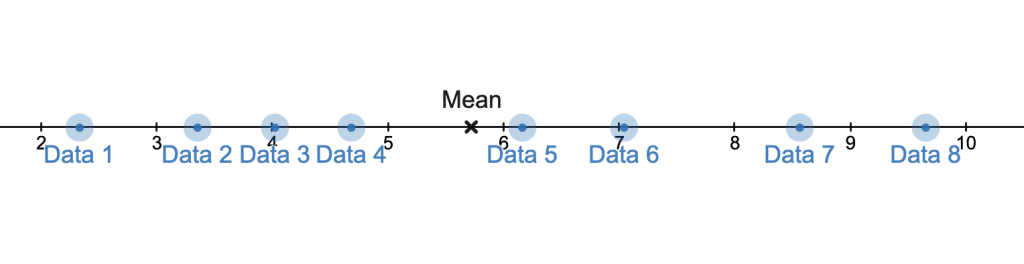
Visualising the Mean of a Data Set (Boxplots)
Boxplot including mean, median, quartiles, IQR and range.
You can drag the data points and see how their value affects each of the statistical measurements.
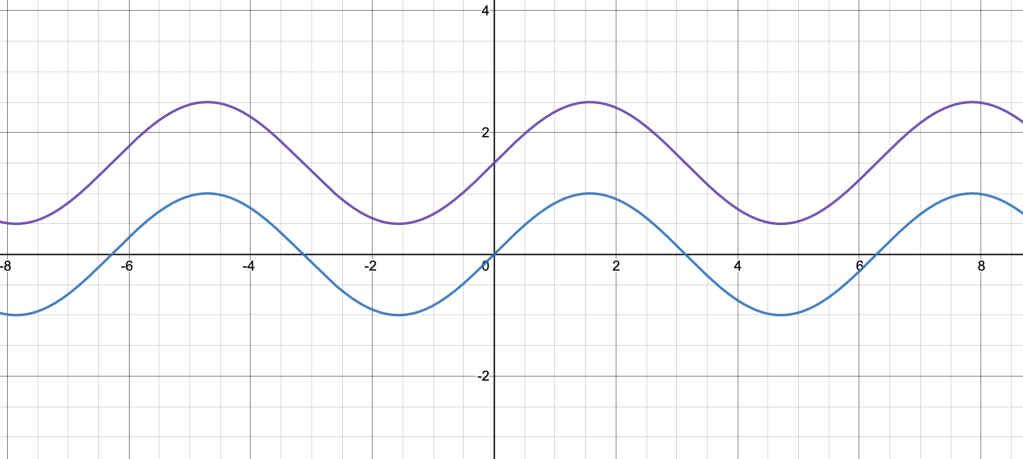
Trigonometric Function Transformations
Follow the on screen instructions to investigate how the different transformations change the graph of the function. Follow the prompts to reflect and describe in your own words.
Great for IBDP or A-level students.
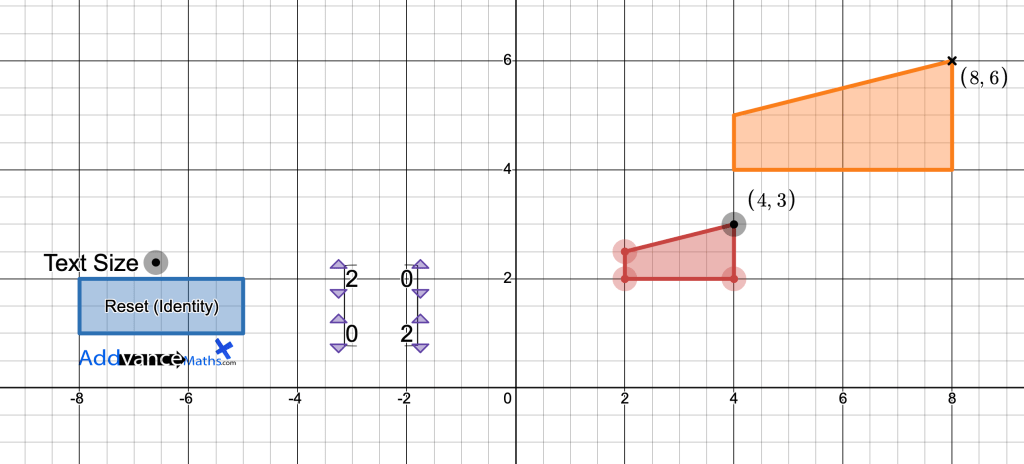
Here you can see a visual of how each matrix transforms coordinates and shapes.
Finding the Tangent and Normal of a Graph
Follow the on screen instructions to try finding the tangent and normal to the function on screen. See how the lines develop step-by-step.
Great for IBDP or A-level students.
Guess the Straight Line (New Version)
Reveal the straight line graphs one-by-one by clicking the circle next to the folders. See if you can guess the equation, then click the folder arrow to reveal the equation. Did you get it right?
Guess the Straight Line Equation (old version)
Midpoints
Use this for simply showing the midpoint between two coordinates. Great visualisation for Year 9.
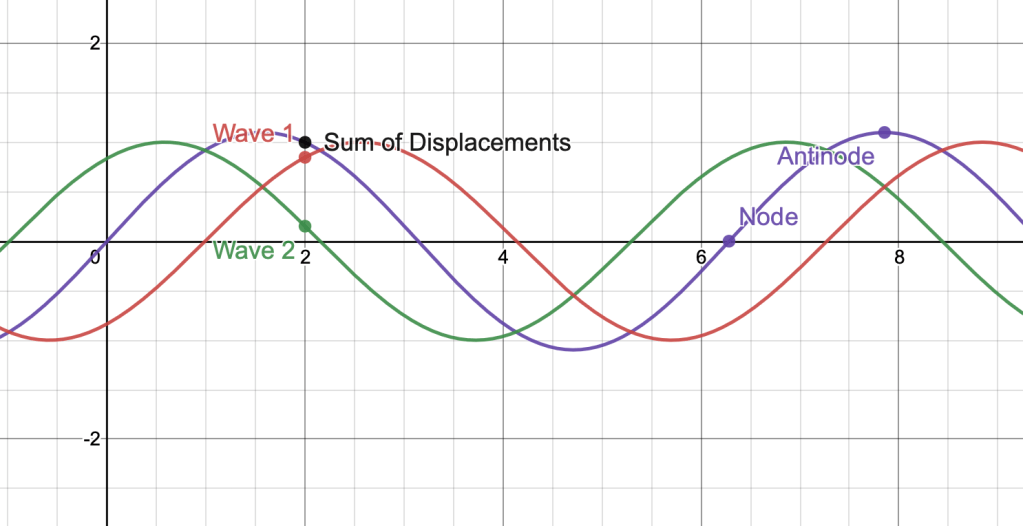
Physics! Stationary Waves Demo
This is for the Physics students/teachers. See a cool animation of stationary waves on Desmos.
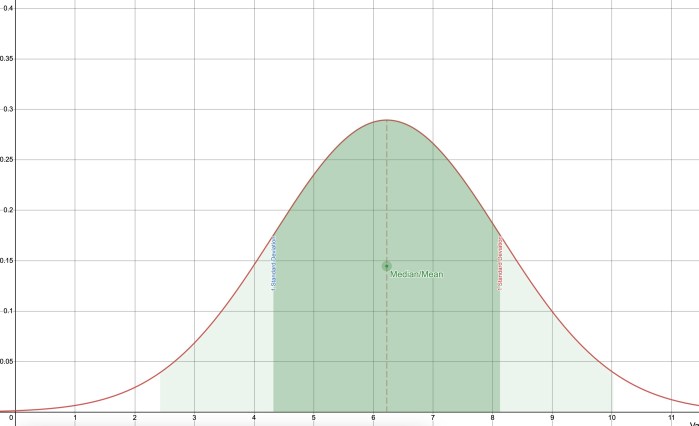
Normal Distribution, Mean and Standard Deviations
See how the normal distribution is affected by the mean and the standard deviation.
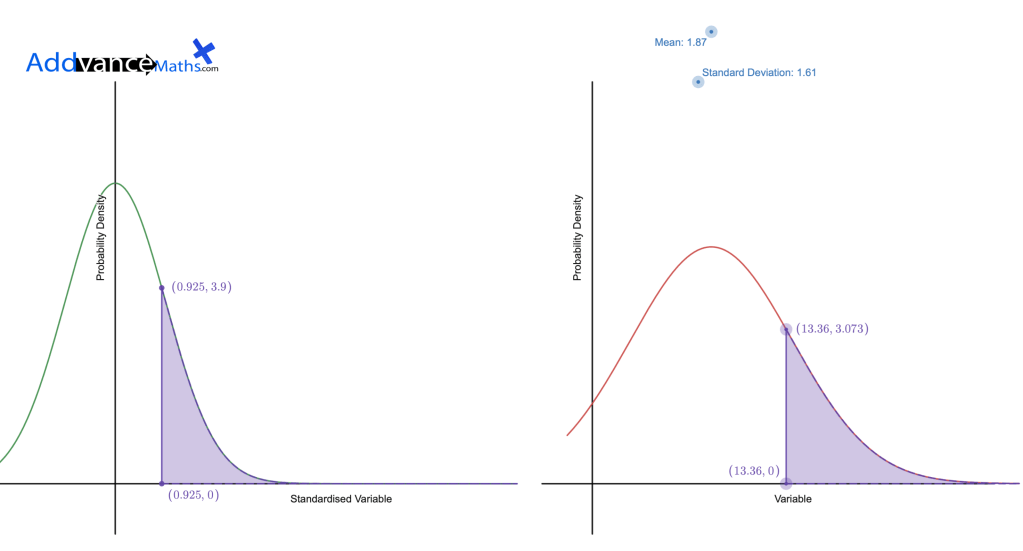
Standardised Normal Distribution
This side to side comparison of the standardised normal versus a regular normal distribution helps students understand the concepts better.
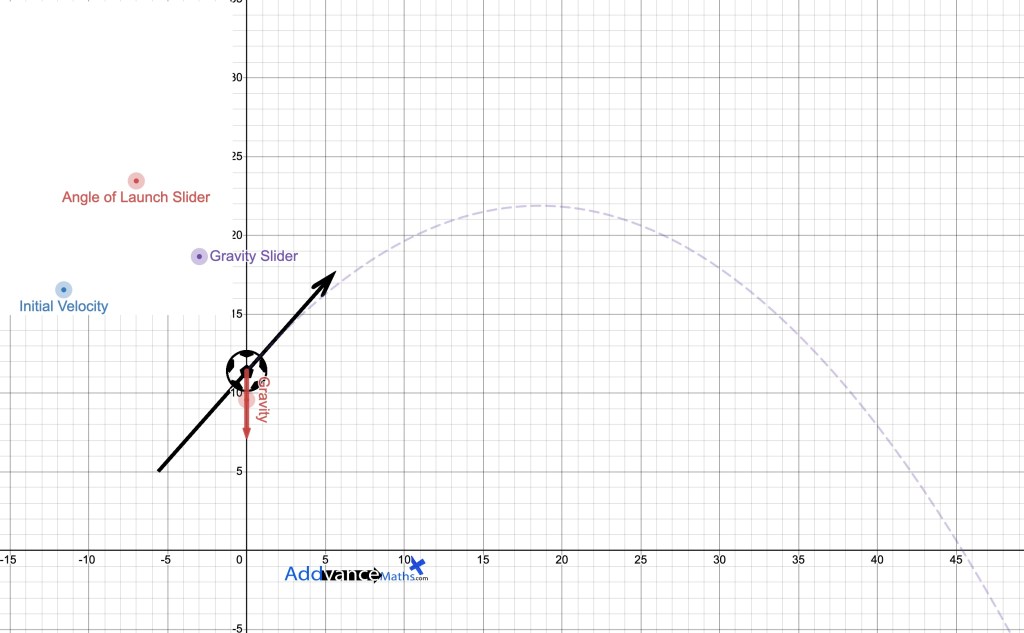
Simulating the Trajectory of a Ball
In this simulation, you can see a live animation of a ball in projectile motion. You can adjust angle of launch, acceleration due to gravity and the initial velocity to see how it will travel through the air.
We can imagine some really deep class discussions around the displacement, velocity (horizontal and vertical) and acceleration of the ball in this demo. We’d love to hear how you used this, please comment below (bottom of this page) with your experiences.
We had a lot of fun making this one.
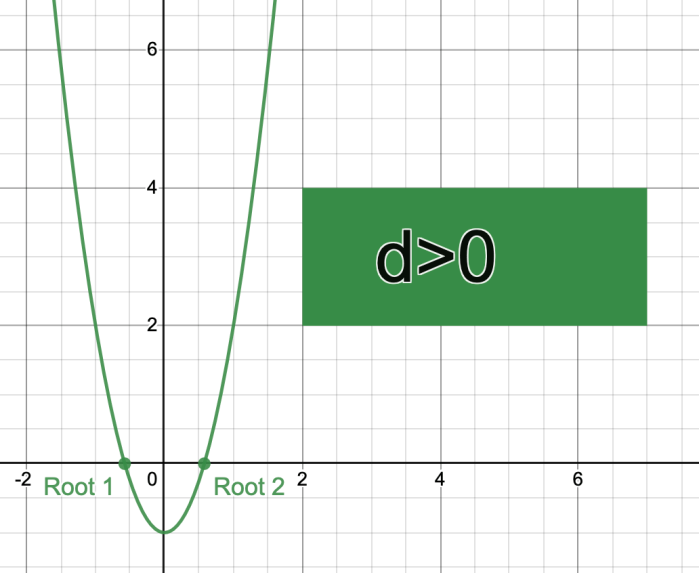
See how the value of the discriminant affects the number of solutions of the quadratic.
More about the discriminant available here
Quadratic Inequalities Visualisation
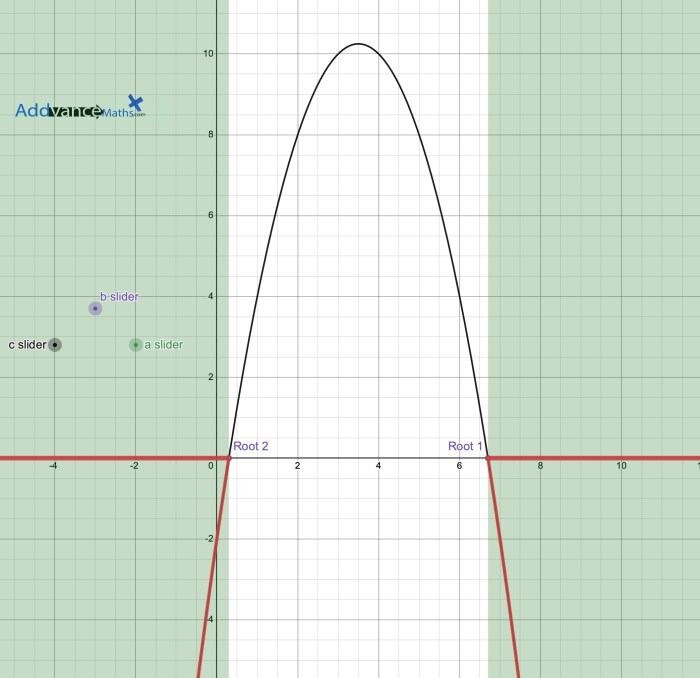
This will highlight the regions of the graph above or below zero. This will help students see what quadratic inequalities is referring to.
Predicting Function Transformations
This is perfect for class discussions or investigations in how functions transform in relation to the equation.
Tangents and Normals Visualisations
This is a simple visualisation to see what a tangent and a normal actually look like on a curve. Drag the blue coordinate to see how the tangent and normal change on the curve.
You can change the function to be anything: quadratic, trigonometric, straight line graph etc.

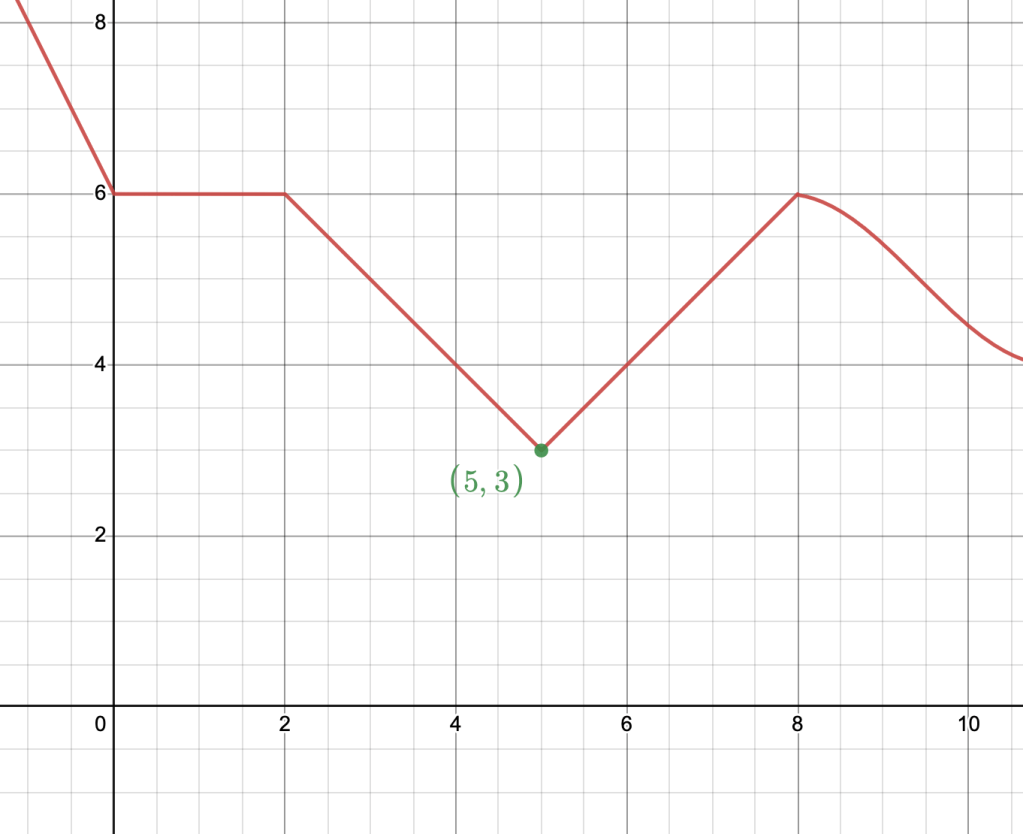
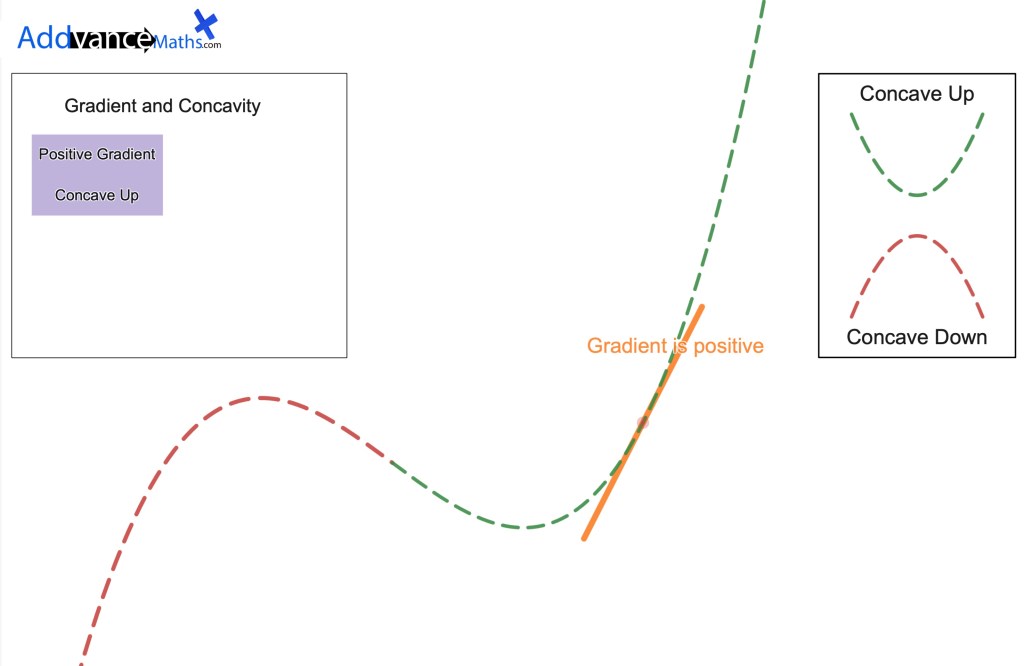
Concavity and Gradient Visualisation
This is a great visualisation to help students understand how the gradient and concavity of a function changes. You can change the function as you wish.
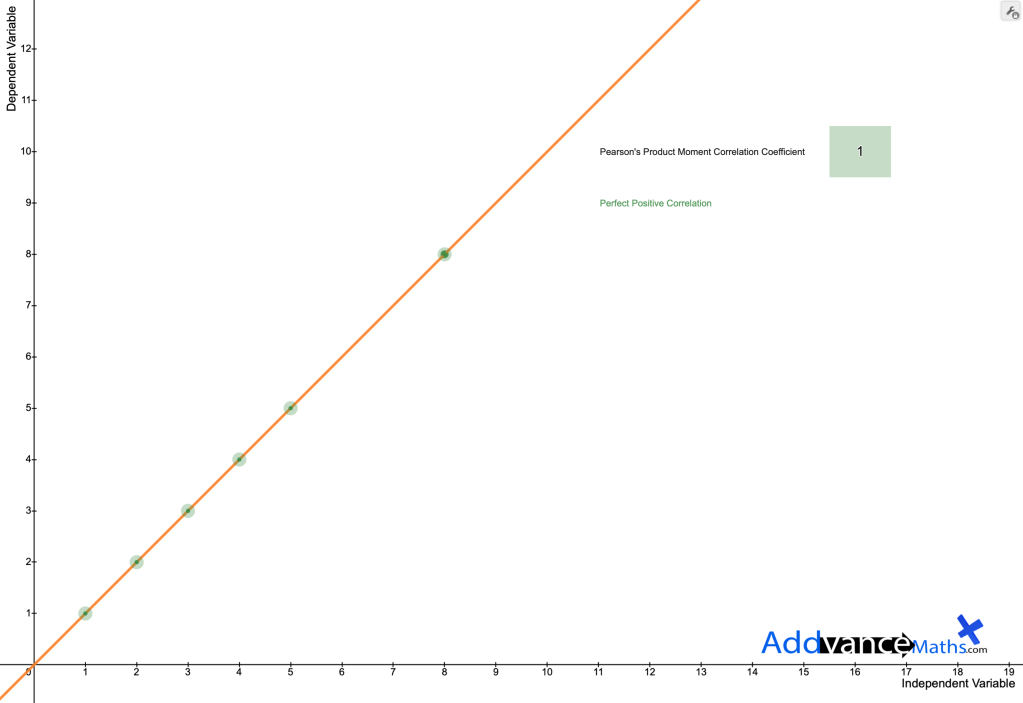
Pearson’s Product Moment Correlation Coefficient
Manipulate the coordinates of a data set in real time and the PPMCC will dynamically change throughout. What do you notice?

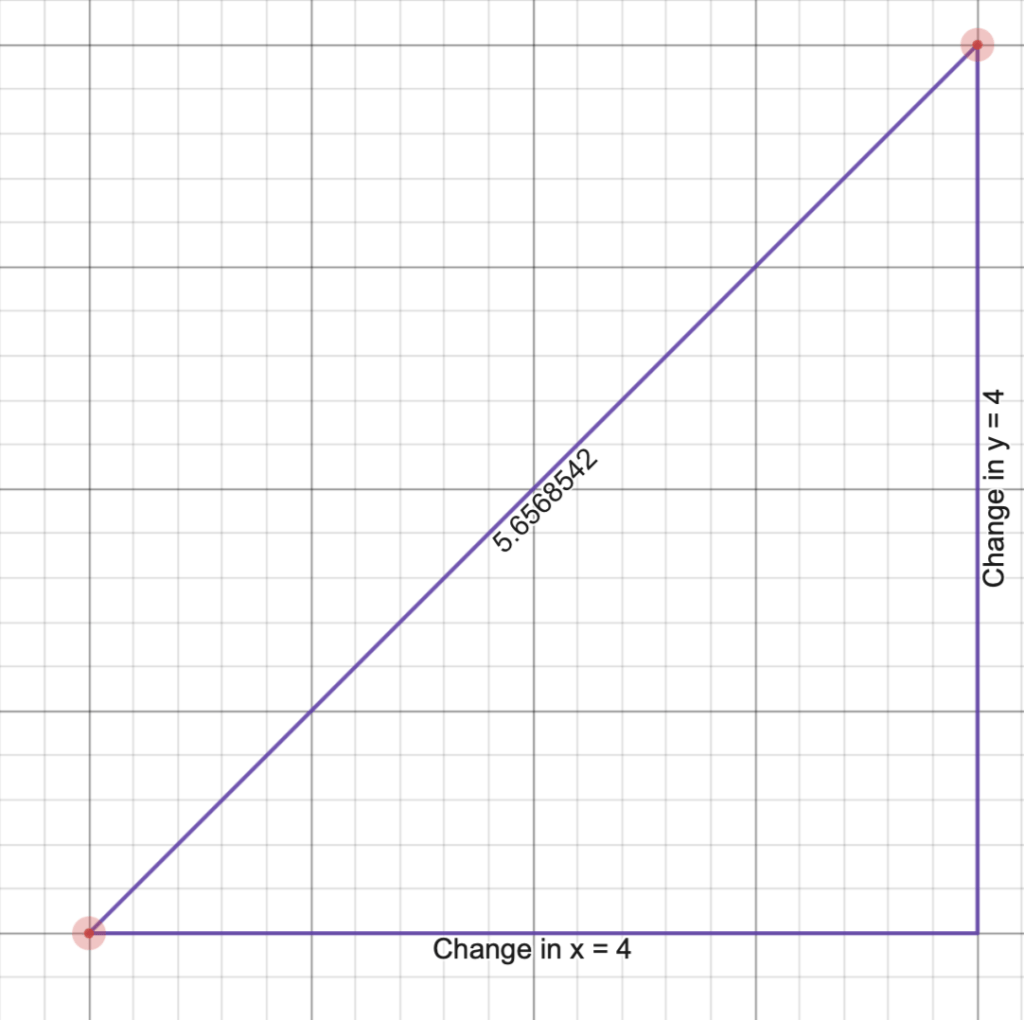
See dynamically how the distance between 2 coordinates on a graph is related to Pythagoras’ theorem.

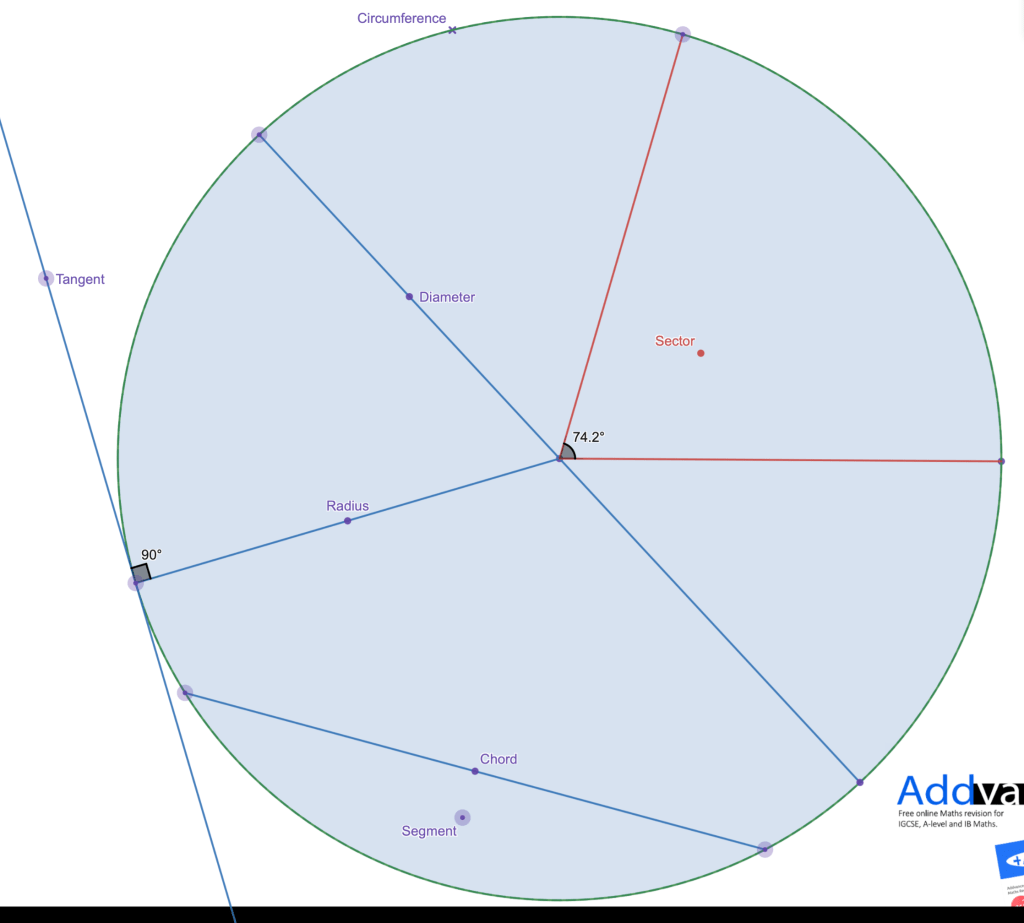
Parts of a Circle
An interactive demo of parts of a circle! ⭕️
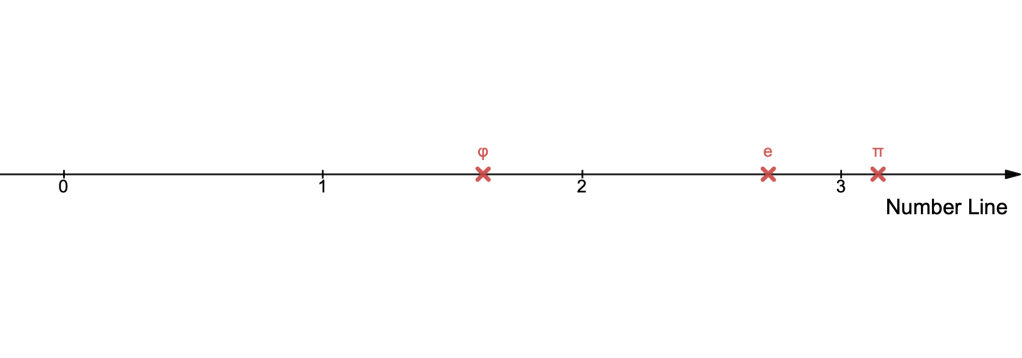
Sometimes the simplest is the most powerful. Explore the number line by zooming out to explore massive numbers, or zoom in to explore decimals. Great for teaching place value!
This simple activity is helpful for students who struggle with concepts of decimal place value.
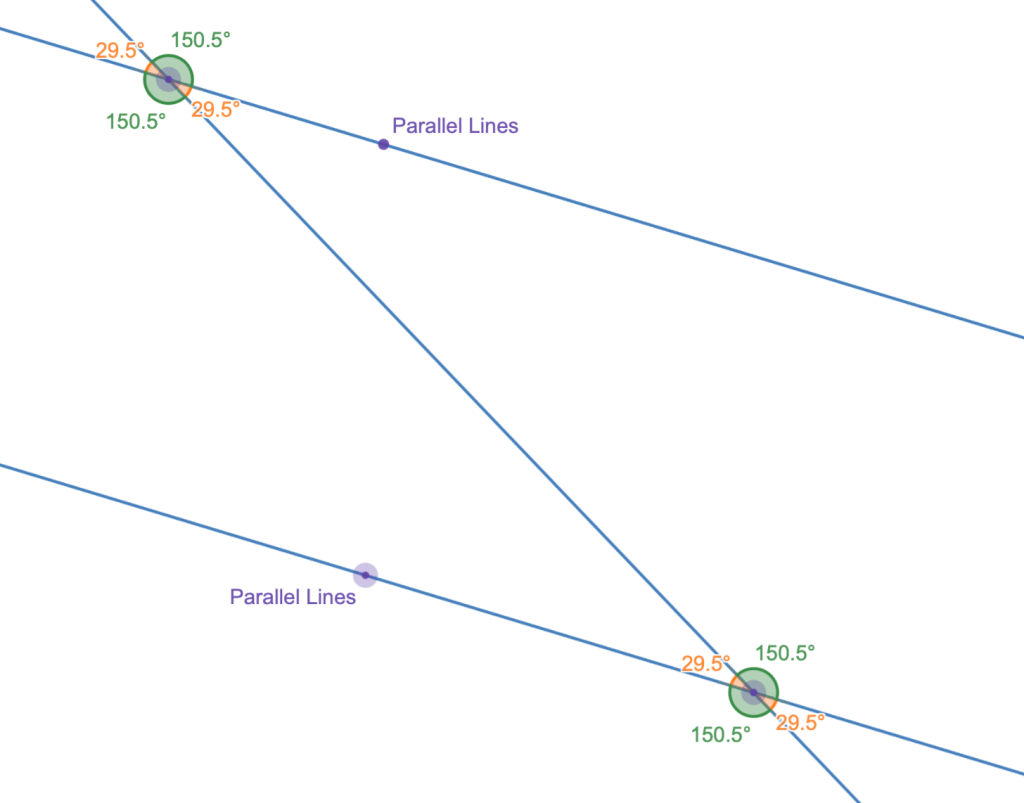
Here you can drag around some parallel lines and see how the angles change, and the relations between them.
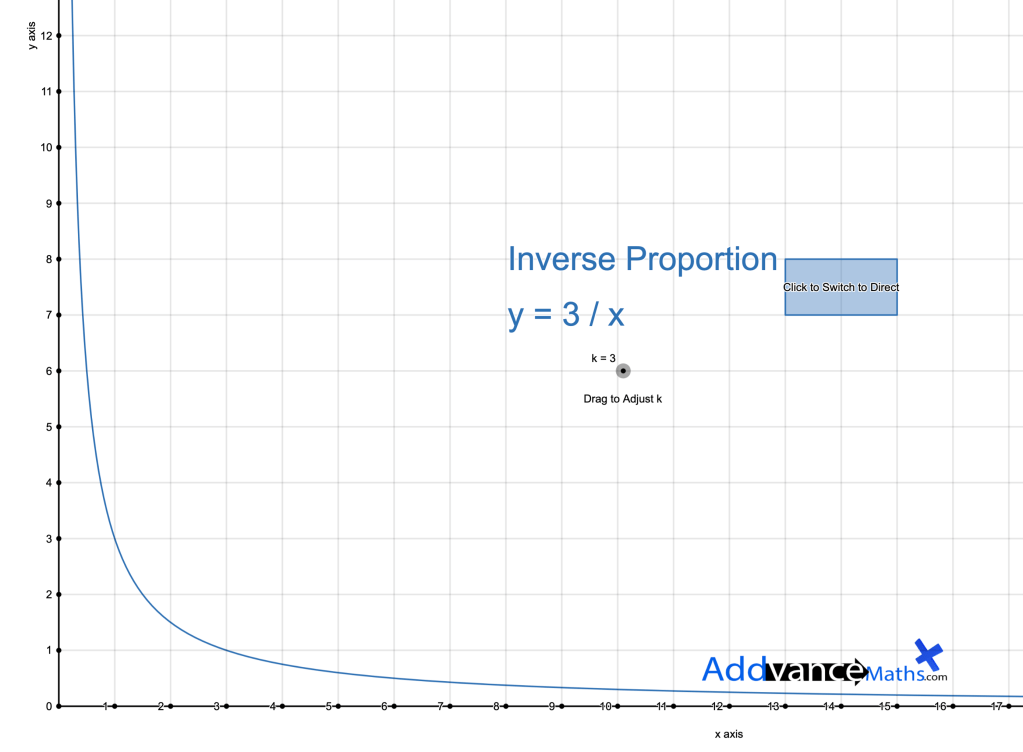
A quick and simple comparison of the graphs for direct and inverse proportion. You can adjust the value of k for each graph.
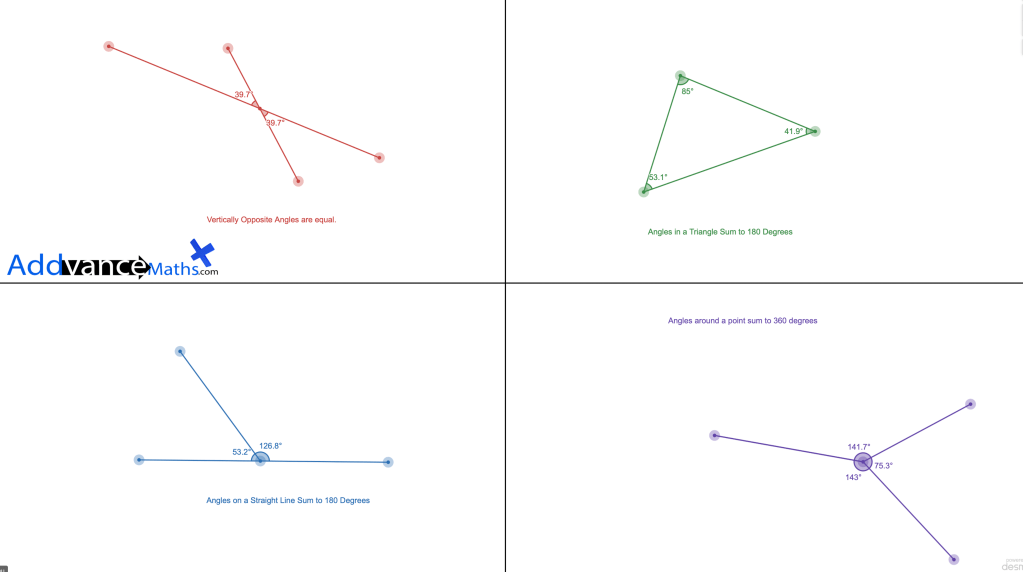
Angle Facts
Explore interactive demonstrations of all angle facts for GCSE and KS3 maths.
More from Addvance Maths!
Addvance Maths creates resources, revision videos, blogs, curriculum guides and more to support students, parents and teachers.
Check out our curriculum guides for British Curriculum Maths!


2 responses to “Desmos Resources”
-
Comment with the kind of questions you asked in class to promote conceptual understanding 😊
LikeLike
-
This page is absolutely brilliant! As a student, I found this very helpful to acquire conceptual understanding of many topics. In particular, the interactive circle theorems graph is simply amazing!
LikeLike

Leave a comment